
PARALLEL SIGHT / INFRASTRUCTURE PERCEPTION
The perception layer
for public infrastructure.
From cameras to an understanding of a place.
What’s there, how it moves, and what changes.
01 / FROM VIDEO TO UNDERSTANDING
Pixels are the beginning.
Understanding is the point.
A detection tells you an object is there. A perception system connects it to a place, a movement, and a moment in time.
- 01
Observe
Recordings & supported feeds
- 02
Perceive
Objects, tracks & trajectories
- 03
Understand
Zones & scene relationships
- 04
Measure
Events & defined measurements
- 05
Remember
State, history & evidence
Platform architecture. Persistent state and connected interfaces are in development.
02 / UNDERSTANDING THE PLACE
Every site has
its own structure.
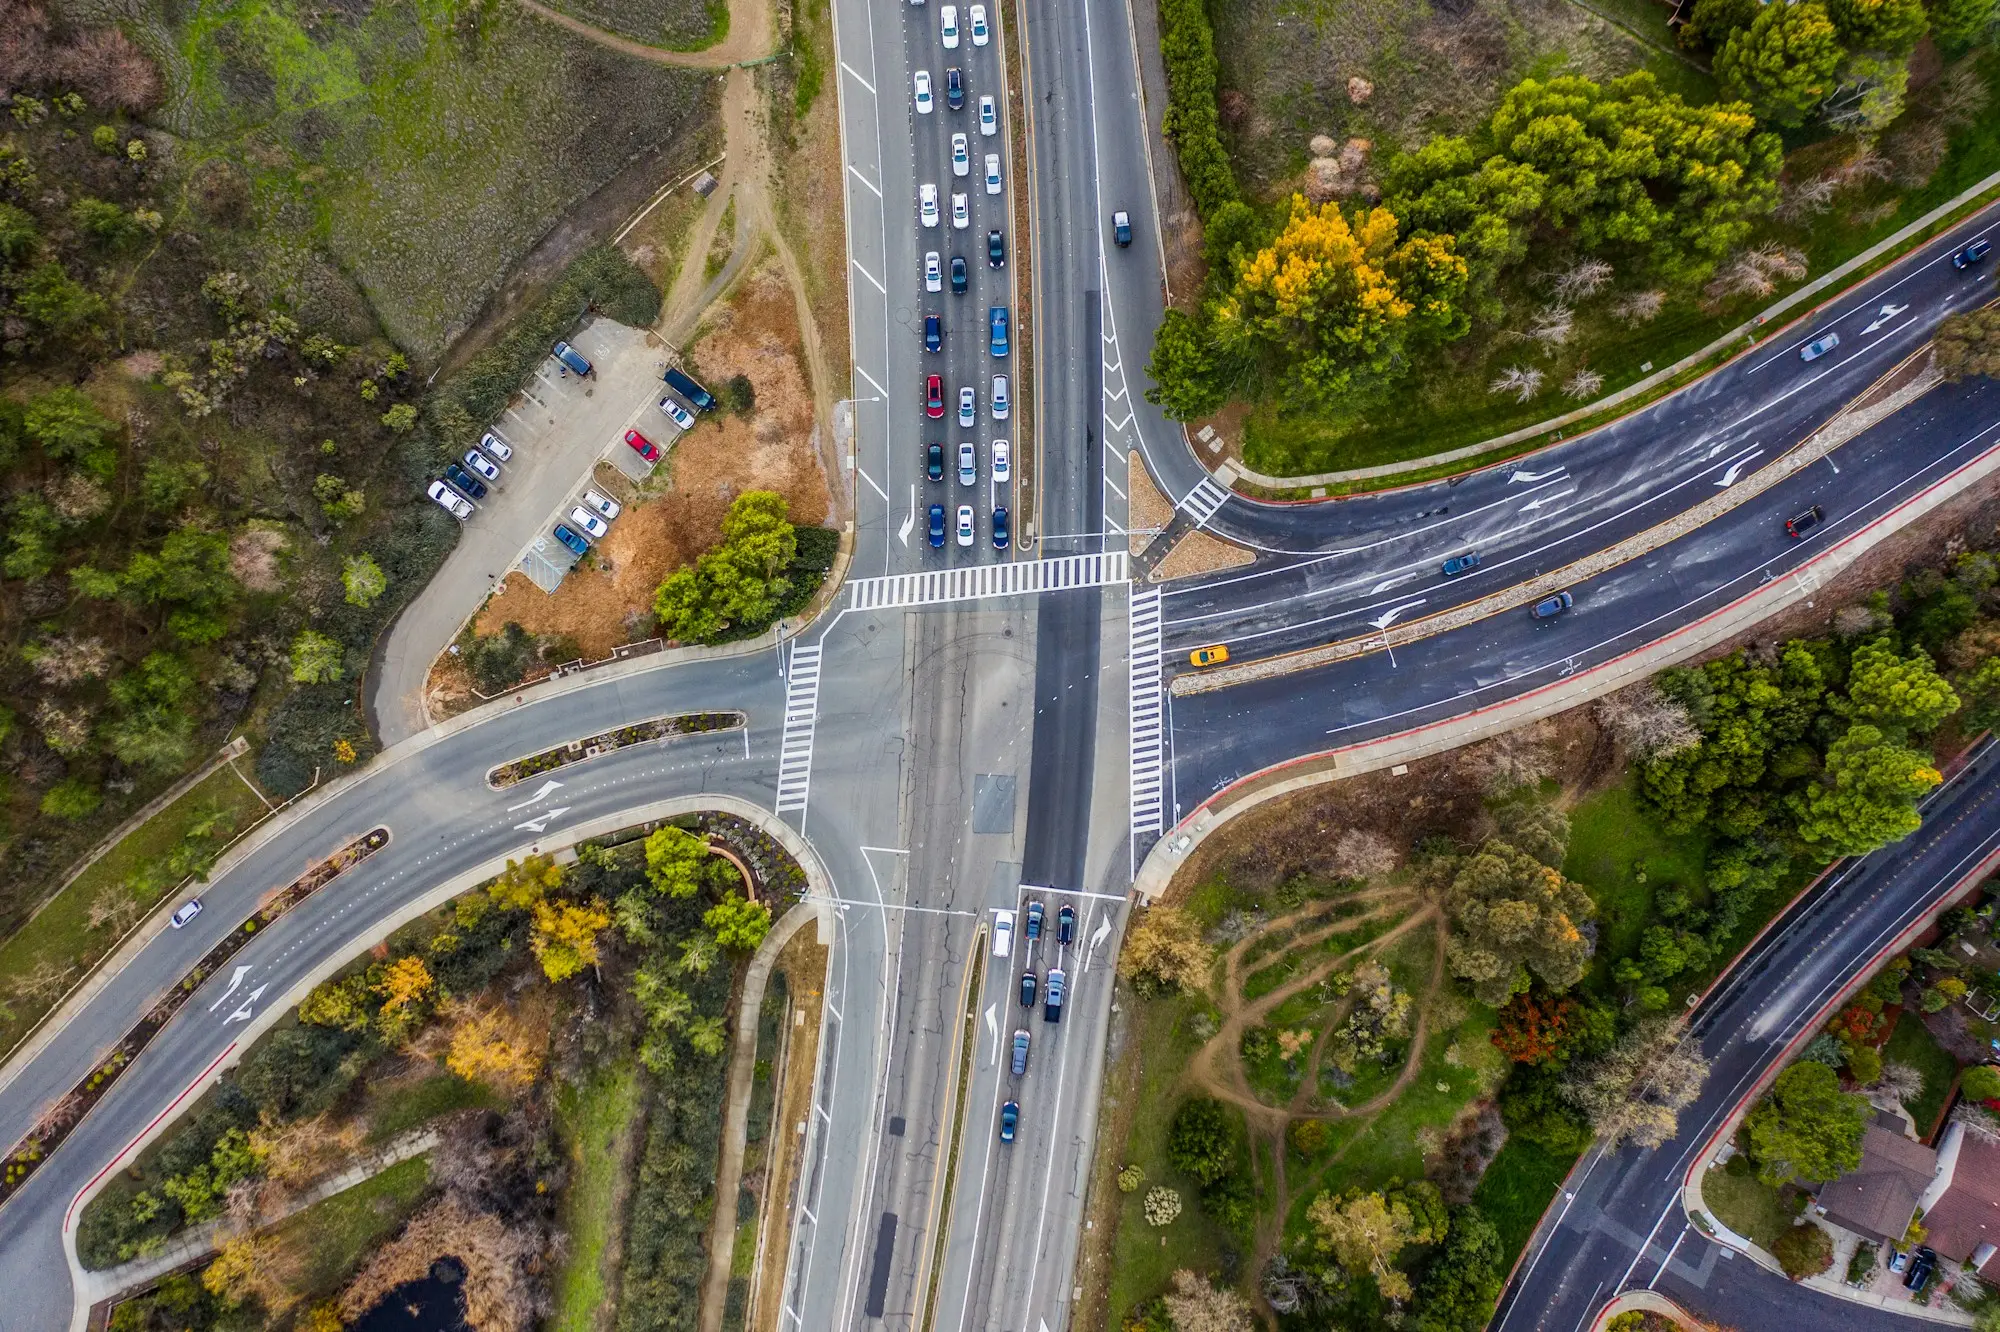
An intersection is more than cars in a frame. It has approaches, lanes, exits, crosswalks, and rules for how movement is measured.
We combine reusable perception with a model of the particular place. Those definitions give observations their meaning.
Explore the site model03 / OBSERVE CHANGE OVER TIME
A place has a history.
Its observations should, too.
The platform is being designed to retain timestamped observations and site context, so questions can extend beyond a single frame.
What is happening
at this site?
Current conditions, with evidence.
How did movement
change through the peak?
Measurements over defined intervals.
What changed between
equivalent periods?
History with consistent definitions.
04 / ONE UNDERLYING MODEL
Built for people.
Structured for software.
Useful understanding should travel beyond a dashboard. The same observations can support a report today and structured interfaces as the platform develops.
Answers you can inspect.
Measurements, reports, visualizations, and evidence for review. Proactive alerts are a platform direction.
Understanding you can query.
Defined measurements, events, state, and evidence references through planned APIs and tools. Agent-compatible by design.
FIRST APPLICATION / TRAFFIC
Real places.
Practical questions.
Start with the footage you already have. Turn transportation video into defined measurements and reviewable evidence.
Explore Traffic- 01Turning movement counts
- 02Traffic & highway volumes
- 03Pedestrians & micromobility
- 04Vehicle trajectories
- 05Stopped vehicles
- 06Curb & loading activity
START WITH YOUR SITE
What do you need
to measure?
Tell us about the place, the footage, and the question you need to answer. We’ll work with you to assess what’s possible.
Apply for a Traffic Pilot